Thursday 19 September 2013

Designing Out Crime

As mentioned in a previous blog, it is possible to design out crime. This can be done by either adapting an existing area to reduce crime levels, or by designing a new area (such as a new housing estate) to make it crime-proof.

Reducing crime in current areas can be done by: designing areas and houses to make it more difficult for crimes to be committed (this is also known as target hardening - adding barbed wire fences, security patrolling an area, adding double glazing to a house and having double locks and security chains on doors). Warnings and alarms can also be added so people can be more aware of when crimes are being committed and as such, people are more vigilant. One final way of reducing crime levels is by tracking goods and people after a crime has been committed (for example GPS trackers in laptops and phones). It is also possible to talk to your local neighbourhood watch group about ways of helping to reduce crime.


The picture below illustrates some of the ways designers design out crime in a new area…


The houses overlooking the open space increases the amount of area which can be monitored for crime. The open space with footpaths allows everyone to keep an eye on suspicious behaviour. Underpasses are problematic for crime reduction as it provides a blind spot for crime to occur in. Finally, the cul-de-sac, as seen on the diagram above, makes it easy to notice someone who is not known to the area and who is not supposed to be there.

The video below shows a case study which could be used in the classroom…


Students could use google maps to find local examples of where crime has been designed out of an area - by looking for cul-de-sacs, open parks etc.

References
http://www.bbc.co.uk/bitesize/ks3/geography/spaces/crime/revision/5/
http://www.bbc.co.uk/learningzone/clips/designing-out-crime/1137.html
http://www.designcouncil.org.uk/our-work/challenges/security/design-out-crime/

Wednesday 18 September 2013

The Location and Mapping of Crime

As mentioned previously, the location of crime is important in understanding why crime occurs. Things such as large population (meaning greater opportunity), good road and transport links (easier to move around) and public spaces which don’t ‘belong’ to anyone are all likely to increase rate of crime. Criminals are more likely to commit crimes in areas which they know well, can easily hide and escape from and in places where there is greater opportunity for crime.

This video is really good for explaining mapping of crime…


At the end of the video it talks about designing out crime, which I will go into in my next blog post.

The London riots of 2011 are a great example of people committing crime because there was the opportunity and the knowledge that because of the scale of the riots, the law was not being enforced to the same degree. The map below (from BBC Bitesize) details where the London rioters originated from. The map is really interesting and shows how social media and technology meant that people in other parts of the UK got involved. As can been seen from the map, in the first couple of days of the riots, it was just locals involved, but by the third day people with direct links to London were rioting and by the fourth day people from all over the country were rioting.


Whenever a crime is reported, it can be plotted onto a map. Geographical Information Systems (GIS) has made it easier to combine information onto a map and as such we can see the spatial patterns. The mapping of crime is a fascinating concept. On the website http://www.police.uk/ it is possible to see all the crimes logged in any one mile radius of a given post code… with the break-down of how they were classified. To be honest, I’m not sure I’d want the students looking at the areas they live in, as it may spark a rivalry between students and where they live. I think it may well be better to find a few examples which show the sort of distributions we can talk about - possibly even look at big cities, versus small villages?

It is important to also have a look at how crime affects the local communities. I have mentioned before about circles of decline in MEDCs and LEDCs, but crime also has a role to play in declining areas. Communities are affected with declining housing prices if an area is known to be a crime hotspot, they may also have to pay higher insurance premiums, as well as being fearful of going out alone in the dark. The local services become strained as they struggle to cope with the number of people in local prisons and the number of people affected physically by crime needing help from the local health service. Shops may no longer stock certain items for fear of shoplifting and the council will need to spend more money on ensuring peoples safety (CCTV and Street lighting) and less on other things (such as education).
  
References
http://www.bbc.co.uk/bitesize/ks3/geography/spaces/crime/revision/3/
http://www.bbc.co.uk/learningzone/clips/mapping-crime-geographical-profiling/1128.html
http://www.police.uk/

Tuesday 17 September 2013

The Classification of Crime

The final section of the ‘Settlement’ topic is the ‘Geography of Crime’. According to the English dictionary, a crime is an act prohibited and punished by law, or a collection of unlawful acts. Whenever a crime happens it has a time, location and a reason, hence Geography is important when studying crime as it helps understand any patterns. By understanding the patterns to crime it is possible to see where crimes are most likely to be committed in the future. As such, it is possible to combat crime with more policing in high risk areas, adapting old buildings to be crime-proof and designing new estates in ways which reduce crime.

Crime is classified into one of the following categories: crime against the person, sexual offence, robbery, burglary, offence against vehicles, other theft, fraud or forgery, criminal damage, drug offences, or ‘other’ - for anything which doesn’t fit into the previous categories. Crime does not only happen on a local or national scale, it can also happen on an international scale.

This topic in teaching…

This would be a really good discussion topic - asking students to discuss what they think the definition of a crime is and getting the students to feedback to the group. There are a lot of news articles on the BBC, or other news websites, which could be used as resources. After explaining the different types of crimes, students could be given a news article per pair and have to work out which type of classification of crime the news article is relating to. These news articles could either be discussed as a group after the students have decided on what their article is referring to, or students could swap articles until each pair has discussed 5 or 6 different articles.


References
http://www.bbc.co.uk/bitesize/ks3/geography/spaces/crime/revision/1/
Crozier et al (eds), 2008. Collins English Dictionary. Glasgow: HarperCollins.
http://www.tes.co.uk/teaching-resource/the-geography-of-crime-6141222/

Tuesday 3 September 2013

Urban Branding

Branding is the associations that a person (or people in general) makes with a company, organisation, product, service or individual. Coca Cola is one of the biggest brands in the world - very few people would fail to recognise the red and white logo or the shape of their glass bottles. Branding is really important - just last month Marks and Spencer hired Dame Helen Mirren along with several other famous women to lead their new ad campaign, in an attempt to boost their brand.

While it is obvious for companies that a strong positive brand should bring in sales, the same is said for cities. City branding refers to the changes made and the promotions that turn a city, from a location, into a destination. It will make a city somewhere where people want to visit, work and live. With cities no longer just competing for attention with towns down the road, it is important their brand is strong to attract people from all over the world.


Many urban areas will go through a stage of re-branding to try and alter people’s perceptions of a city or town. This could be environmental (improving building quality), social (reducing poverty), economic (increase job opportunities) or political (successfully bidding for grants). One example is Manchester, which in 1991 embarked on a major rebranding exercise. It aimed to portray the city as lively, cosmopolitan, dynamic and culturally enlivened and was accompanied by visual images presenting Manchester as energetic, innovative and culturally sophisticated. The new brand also came with the slogan “The Life and Soul of Britain”. The regeneration and rebranding was pushed again after the 1996 Manchester IRA bombing, in an attempt to bring people back into the city. With thanks to the 2002 Commonwealth games, which were hosted in Manchester, the city is now known as being a city of sport. Not only are there two football stadiums, the National Squash Centre and the Manchester Aquatics Centre, the National Cycling Centre is also based in Manchester, which is home to British Cycling (who train up Team GB hopefuls). 


References
http://www.theguardian.com/society/2008/oct/01/city.urban.branding
http://www.retail-week.com/in-business/marketing/marks-and-spencer-hires-dame-helen-mirren-to-lead-all-star-ad-campaign/5052215.article
http://www.placebrands.net/reading/citybranding.html
http://www.geography-fieldwork.org/urbanfieldwork/urban_rebranding/stage1.htm
http://upload.wikimedia.org/wikipedia/en/thumb/4/42/2002_Commonwealth_Games_logo.svg/175px-2002_Commonwealth_Games_logo.svg.png
http://www1.imp.unisg.ch/org/idt/ipmr.nsf/0/7e675f0a71bd4d16c1256e0400524fa5/$FILE/IPMR_4_2_THE%20REBRANDING%20OF%20CITY%20PLACES.pdf
http://en.wikipedia.org/wiki/Manchester#Geography

Monday 2 September 2013

Urban Design

Urban design is the process of designing functional, attractive and sustainable urban areas. Urban design focuses on large scale groups of houses, streets, whole neighbourhoods and even entire cities, rather than singular buildings as architecture does.


The main objectives for urban design:
  • Character - to build places with identity by reinforcing local patterns of development and culture.
  • Continuity and enclosure - public and private spaces need to have clear boundaries to make harmonious living easy.
  • Quality of the public realm - there must be attractive and safe outdoor areas, which can be successfully used by everyone.
  • Ease of movement - places which are easy to move through. This includes the streets. Spatial analysis software can be used to analyse how people would move through proposed city plans.
  • Legibility - places need to have a clear image and routes that are easy to understand. This can be made easier by having landmarks which aid people in finding their way around.
  • Adaptability - places need designs that can adapt to changing social, technological and economic conditions.
  • Diversity - places which promote diversity and choice, with a range of housing types and price.

Urban design dates back even as far as the Roman times when Vitruvius (thought to be the first architectural historian), created a blue print for an ideal city. Vitruvius created a circular design to promote harmony. Other designs are born out of idealism, such as the 16th Century Utopia design by Thomas More. Some designs however, were created to display wealth and power.

As wonderful as many plans are, it is rare to be able to make a city from scratch. When the Great Fire of London burnt down the city, it was seen as a fresh start. Wren, Hook and Evelyn all created plans for a complete rebuild of London. Wren based his rebuild on various sources including Vitruvius and Parisian design; Hook created a grid plan layout with blocks and Evelyn based his plans on a radial grid.  In the end though, it was decided that instead of using any of the fantastic and elaborate plans which were put forward, it would be up to the people to rebuild their own plots. This decision was based upon the fact that London, in this time of disaster, could not afford the time or the money to rebuild the city completely from scratch. The money could be raised, but it was ultimately that in the time it would take to rebuild the city, business would be drawn elsewhere and if the business did return, moving may be confusing due to the rebuild.

In 2007 Gordon Brown announced his plans for tackling climate change and solving the housing crisis - designing Eco towns. Eco towns were billed as being: affordable housing, sustainable living, carbon neutral developments, a creative use of waste and high rates of recycling, employment which is local, as well as local services and schools so that there is less demand for using cars. Finally the locals must also be able to have a say in the development. Whitehill, Bordon is one of the four Eco towns announced in 2009. Despite an unclear future in 2010 when the new government came into force, in January 2013 the MOD land (brownfield site) was purchased and building work is expected to start in 2014, with the finished 100 homes completed by the end of 2015.

References
http://www.bbc.co.uk/iplayer/episode/b0394j6q/Dreaming_the_Impossible_Unbuilt_Britain_A_Revolution_in_the_City/
http://www.bbc.co.uk/schools/gcsebitesize/geography/urban_environments/urbanisation_medcs_rev8.shtml
http://www.bbc.co.uk/news/uk-england-hampshire-20911094
http://webarchive.nationalarchives.gov.uk/20110118095356/http:/www.cabe.org.uk/files/urban-design-skills-working-group.pdf

Notting Hill

Notting Hill is one of the most famous examples of gentrification. In a BBC article from last year, it was argued that Portobello Road (in Notting Hill) is the UK’s most gentrified street. Looking at the bustling urban area with grand houses and the occasional blue front door as it is today, it is hard to believe Notting Hill used to be one of the worst slums in London.

In the mid-eighteenth century Notting Hill was a hamlet known for its gravel pits and roadside inns. Urbanisation, in the form of industrialisation, brought workers from the countryside and as such, landlords built tiny terraced houses to supply demand and rent to the poor. During the Victorian times the area was a rough, working class area. The 1950s was when it hit the all-time low for deprivation and slums.

The abolition of rent control in 1957 triggered the start of gentrification in Notting Hill. Many landlords bullied their tenants into leaving, so they could cash in on the lucrative housing market. Since then (and particularly in the more recent decades) gentrification has been on the up, as have the house prices. However, it’s not completely unaffordable housing. In an attempt to re-enforce the diversity of the Notting Hill neighbourhood and to maintain controlled rents and ensure some housing remains affordable, Housing Associations have kept a strong hold.


The movie “Notting Hill” with Hugh Grant and Julia Roberts helped to popularise the area with people around the globe. This tempted movie stars, singers, fashion designers and media types to the area further gentrifying it (or as the BBC put in their article - Super Gentrifying it). Both bench scenes in the movie show off Notting Hill’s secluded communal gardens better than any estate agent could. The gardens, which are sandwiched between the rows of houses, are, as Hugh Grant’s character in the movie points out, barely visible from the street. These gardens make the area very popular with families. 


Within Notting Hill is the world’s most famous market - Portobello Road. Since 1837 the market (technically several markets one after another) has sold just about anything you could wish to buy. In the 1971 film ‘Bedknobs and Broomsticks’ the characters visit Portobello Road in an attempt to find the other half of a spell-book. Along the way, the characters discover what Portobello Road is all about - below is a video clip of the Portobello Road scene. It is 10 minutes long… but from about half way through it is just dancing!!!


The topic in teaching…
The film Notting Hill is rated 15… and some of the key scenes for showing off the geography of Notting Hill have some choice language, so wouldn’t be something I’d show (there are only a few really good scenes for geographical use anyway!!). The scene about Portobello Road from ‘Bedknobs and Broomsticks’ however is a classic and would be really good to introduce the topic and also to show the difference between before and after gentrification.

References 
http://brooksbankgeographyyr13.wikispaces.com/Case+Study+-+Gentrification
http://www.ipglobal-ltd.com/investor-centre/investment-newsletter/regeneration-and-gentrification-in-london.html
http://www.bbc.co.uk/news/magazine-18394017
https://www.youtube.com/watch?v=LYBECKl0zFo
http://www.suitcasemag.com/post/cinematic-hotspots-notting-hill--547/
http://hookedonhouses.net/2009/09/13/notting-hill-hugh-grants-house-with-the-blue-door/

Sunday 1 September 2013

Change and Regeneration

The majority of changes in urban areas are due to urbanisation. Urbanisation means an increase in percentage of the population living in urban areas (rather than rural areas). This is caused partly by more people being born in urban areas than rural, but mostly because of rural-urban migration. Congestion, lack of space and pollution are real problems caused by an increased number of people living in urban areas. Several changes have occurred in recent years to help reduce the problems.

First: Congestion. Many of the UKs largest cities were built hundreds of years ago and as such were not designed to withstand the number of cars which drive through our streets on a daily basis (particularly during rush hour). Many cities have implemented the generic go-to systems of Park and Ride schemes, pedestrianisation and improving public transport. London however, has gone many steps further. In February 2003 the congestion charge was introduced into central London. Using number plate recognition technologies, cars were monitored against the database of people who have paid to enter the congestion zone. The charge (currently £10 a day) is set to deter people from entering the city and the money collected is invested into improving public transport. Another major change was introducing the Barclays Bike Scheme, where people can borrow bikes for a minimal cost, for short journeys around the city. Bike lanes have also been added to reduce the number of accidents involving cyclists. To coincide with the Olympics in 2012, a number of underground lines were extended, or improved, to allow greater access and fewer delays getting into and around London.

The second problem is lack of space. The only real solution is to build upwards and to use space economically.

Pollution is the third issue mentioned above. This air pollution, or smog, affects most major cities and is seen as a haze (particularly noted to be seen in Los Angeles). The methods used to reduce congestion will also reduce pollution because fewer motor vehicles are in the CBD to produce the pollution. Other changes which can be made to reduce pollution include: banning heavy goods vehicles from CBDs altogether, providing more bins (including recycling bins) to reduce litter within the CBD and also developing cleaner fuels.


Other issues in need of change in Urban areas include, overcrowding, poor-quality housing as well as lack of open space. Many of these issues are improved during regeneration projects. Various regeneration projects have been mentioned throughout my blog - in the Urban Structure of MEDCs blog post I mentioned gentrification and gave Clarendon Park as an example. Gentrification is just one of many forms of urban regeneration. The table below details some of the other ways in which urban areas change…


The topic in teaching…

There are plenty of case studies about regeneration (I’ll look into Notting Hill in my next blog post). Below is a really good link from the Royal Geographical Society on the urban regeneration of east London. This could be used as a basis for a lesson, or even the basic information given to students, before they are set off to collect more information on east London’s regeneration, to present back to the class.

References
http://www.bbc.co.uk/schools/gcsebitesize/geography/urban_environments/urbanisation_medcs_rev1.shtml
http://greenfieldgeography.wikispaces.com/IGCSE+Settlements+and+GCSE+Settlements
http://www.rgs.org/NR/rdonlyres/7F628840-98F9-4E52-9BFD-E4CBBDAF1EEB/0/KS3_FactSheet_EastEndregeneration_2.pdf
http://www.s-cool.co.uk/gcse/geography/settlements/revise-it/urbanisation
http://en.wikipedia.org/wiki/London_congestion_charge

Saturday 31 August 2013

Bid-rent Theory

The concept of bid rent is vital to models of land use and as such, it is important to have an understanding of it to know how urban areas may grow. Bid rent is the value of land for different purposes. As I have mentioned in previous posts, the land at the centre of the city is the most expensive due to its accessibility (by public transport) and the small amount of land actually available (hence the high-rise buildings). As such, land prices tend to decrease away from the CBD, although there are peaks in particularly desirable areas (near main road intersects). This type of land-use is also recognised in Burgess’ model.

The graph below (from s-cool) is one of the best representations of bid-rent theory I’ve seen. It clearly depicts what the various land users are willing to pay for land. 


The graph clearly shows that commerce is willing to pay the largest amount in rent to be located in the CBD. Department stores and national chains are willing to pay the high rent, to get the footfall (and as such, turnover) that only the highly accessible CBD can offer. Many stores in the CBD maximise their square footage by building plenty of levels (stories) to their store. The rent that commerce is willing to pay is the steepest line on the graph - which means the amount of rent commerce is willing to pay declines quicker per kilometre out of town, than any of the other land uses.

Industry needs land available to build factories and as such, they are not willing to pay the high prices for the land within the CBD. As long as Industry sites are within easy distance of the CBD, to make use of the communication and market place, they are willing to pay to be on outskirts of the CBD.

Area 3 is unattractive to commerce and industry and as such residential building does not get priced out of the running for land. Without the competition from industry and commerce, the land is cheaper and so it is possible to build larger houses with gardens.

It is possible to see the connections between bid-rent and Christaller’s hierarchy and threshold within Central Place Theory. Clearly, with the building of out of town shopping centres and main roads this pattern does not always work, but it is a good model to aid understanding. The diagram below (page 273, from Nagle, 2001) shows the variations in bid-rent with accessibility. I think the two diagrams shown in this blog would be really good diagrams to analyse as a class (or to start with, individually) as part of a KS5 lesson.


References
http://www.s-cool.co.uk/a-level/geography/urban-profiles/revise-it/central-place-and-bid-rent-theories
Nagle, 2001. Advanced Geography. Oxford University Press.


Friday 30 August 2013

Walter Christaller

Christaller introduced the conceptual framework that is Central Place Theory (CPT) in 1933. Central Place Theory essentially states that if an area of land is flat and featureless and there is an even distribution of population, as well as equal money and transport opportunities, then settlements will follow a distribution pattern according to their size. CPT attempts to illustrate the concepts of threshold and range of settlements, how settlements locate in relation to one another as well as dealing with hierarchy of settlements.

Threshold and Range
The minimum sales that an establishment must secure in order to survive is the threshold population. The relationship between threshold population and number of establishments is exponential (similar to y=e-x).

The range is the maximum distance the population is prepared to travel to purchase goods from a central place. This will be different for convenience and comparison goods, in general people are willing to travel further for comparison goods than they are for convenience. Hence convenience goods will have a short range and comparison a long range.

Hierarchy
This is exactly what I mentioned about in the ‘Rural Characteristics’ blog post when I spoke about the function and hierarchy of a settlement. Hierarchy is essentially made up of three steps: first, the higher order settlements are generally larger in size and offer more functions; second, higher order settlements occur less frequently, and as such, are spaced further apart. Finally the hierarchy is stepped as can been seen in the graph in the ‘Rural Characteristics’ blog post.

Nesting
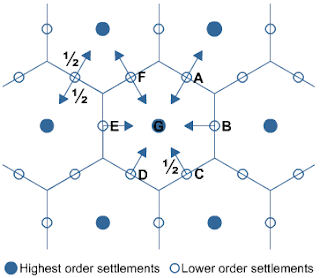
This is the main part of central place theory that the S-cool website goes into. Each settlement is surrounded by a market area it serves. The largest settlements are found at the centre of the hexagons and are surrounded by smaller settlements. The larger the settlement, the greater the market area. The idea is that people from the small villages will only visit their large settlements for anything not provided by the village - they cannot cross the boundaries.

The distribution of nesting will follow one of three patterns: Firstly, Market Optimising. In this pattern, shoppers in the smaller settlements divide into three equal groups when shopping in the three larger settlements.


Second: Transport Optimising. Shoppers in the smaller settlements divide into two equal groups when shopping in the two nearest large settlements.


Third, and finally: Administration Optimising. All shoppers in the smaller settlements shop in the nearest large settlement. 


References
Nagle and Spencer, 1997. Advanced Geography Revision Handbook. Oxford University Press.
http://www.britannica.com/EBchecked/topic/102569/central-place-theory
http://www.s-cool.co.uk/a-level/geography/urban-profiles/revise-it/central-place-and-bid-rent-theories

Thursday 29 August 2013

Urban Structure - LEDCs

Although LEDCs have similar land uses to MEDCs, their layout is very different. The CBD is still the central section, with the highest priced land. However, the next section isn’t the cheap housing and industry as it is in MEDCs, instead you’ll find high cost housing - normally luxury high rise apartment blocks and / or detached houses.

Industry, instead of being in the inner city, is found along the main transport routes. Going outward from the luxury housing are the areas of semi-permanent informal housing, while at the very edge of the city are the favelas.

Favelas are illegal settlements, built from mud, straw and scrap metals - whatever they can find. There is no gas or electricity and no drains, sewage or water supply. The people in favelas pay no rent or rates, the roads are unmade and there is high unemployment. Where people do have jobs they are temporary, part-time and low paid. Any of the very limited public transport that goes as far as the favelas is overcrowded and dangerous. There are major crime problems in the area, few schools and very little medical care. For many residents though, they come from the countryside to the city looking for a better way of life.


Below is the LEDC urban structure model (from BBC Bitesize)…


The topic in teaching…
I read somewhere a lesson plan where the teacher collected a variety of scrap material and asked students to have a go at making their own favelas out of what they collected. I think this would be a really good activity to get students involved, providing I could tie in some suitable aims for the lesson.

References
http://www.bbc.co.uk/schools/gcsebitesize/geography/urban_environments/urban_models_ledcs_rev1.shtml
http://www.s-cool.co.uk/gcse/geography/settlements/revise-it/urban-morphology

Wednesday 28 August 2013

Urban Structure - MEDCs

Urban structure is made up of various different zones. Within MEDCs there are generally 5 zones: the Central Business District (CBD), inner city, inner suburbs, outer suburbs and countryside. Each zone tends to have its own particular land use. The CBD is an area of high density, high rise buildings which occur because competition for land is high here. CBDs are normally pedestrianized, contain the main shopping areas, have a bus and train station, plenty of banks, offices and entertainment venues and cafes. Car parking is generally found on the edge of the CBD. The CBD is where most business and commerce is found. A good example for picturing the CBD is the pedestrianize areas of Leicester City Centre - particularly around the clock tower.

The inner city is found next to the CBD and mainly consists of houses in a grid like pattern (think Coronation Street). In the 19th Century these terraced houses were built to house factory workers who worked in the inner city factories. They are generally 2 up 2 down houses with an outside toilet and are found near the canal or railway. When the terraces were built, there would have also been a factory nearby, as well as a public bath and park in the area. Each street would have also had a pub or corner shop. During the 1960s many of the factories started to close down, which led to unemployment and other socioeconomic problems, which in turn meant periods of unrest in many inner city areas. Many of the old terraces were knocked down and replaced with flats and maisonettes.  In recent years many of these areas have undergone a period of regeneration, some have had retail parks built on the former industrial estates, for example Watford Arches Retail Park. Run down terraces are often bought by investors who adapt the houses for modern living, adding an inside bathroom and in some cases adapting houses for the student market. A great local example is Clarendon Park in Leicester - a very popular area for students of the University of Leicester to live in. Many of these terraced houses have been adapted to house 2, 3, 4 or 5 students. Other investors will improve the terraces to appeal to young professionals who need to access the CBD. This process of renovating the inner city areas is called gentrification.

The next zone is the inner suburbs. This area contains housing which is nearly all detached or semi-detached. Mostly built in the 1920s and 1930s, the housing is medium sized, generally has a garden and a few have a garage. Places of worship, schools and parks are often present as well as shopping centres which can sometimes be found here.

The outer suburbs are made up of detached houses. These tend to be large new houses with garages, gardens and trees. In the late 20th Century housing estates were built in the suburbs, arranging the detached houses along roads arranged in cul-de-sacs and wide avenues. New shopping centres, council estates, modern factories and open parks and spaces are found within the outer suburbs.

The final zone is the countryside. There are few houses found here, mostly fields, trees and according what I wrote in my GCSE work book, sheep.

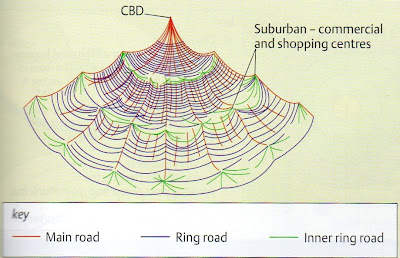
Geographers have created models of what a typical city should look like. One of the most famous is the Burgess model, also known as the concentric zone model. As you can see from my drawing above, the order in which I went through the zones fits with the Burgess model. The idea is that land values are highest in the centre of the town or city, because competition his high in the central parts of the settlement. This leads to layout as mentioned above, with the highest density of buildings in the centre and density decreasing the further out one goes.

The Burgess model…

Clearly, this will not fit every city, as not every city is a ‘typical city’. On top of this, the Burgess model was developed before mass car ownership, which does affect the model as I will look into below. Finally, the model does not take into account the many people who choose to live and work outside the city.

The Hoyt model (see below) aims to solve a few of the issues with the Burgess model. It is still based on the concentric rings, but also takes into account the transport and physical factors which affect a settlements layout, as well as the knowledge that houses were built along main roads to ensure easy access to the CBD. The model also takes into account that factories were built along railways and canals, so that raw materials and the finished products could be transported easily. Some of the other outward developments acknowledge the fact that many cities grew outwards on the flattest land, as it was easier and cheaper to build on.


The topic in teaching…

From looking in my work book, when I learnt about this, it was a case of copying down diagrams from the board and working through things as a class. I’m not really sure how far I could deviate from this, but one activity I did see that I thought was really good is shown below…


This was given to us as a sheet of 9 jigsaw pieces which we had to cut out and fit together to make the town. Following from this we then coloured in the sections to show how the town grew - from just the centre in the 1700s, to the growth of the 1900s and then the extension to add the suburban estates in the 1950s. The key on the bottom left hand side of the picture notes the corresponding colours to years of development.


References
http://www.bbc.co.uk/schools/gcsebitesize/geography/urban_environments/urban_models_medcs_rev1.shtml
http://www.bbc.co.uk/schools/gcsebitesize/geography/urban_environments/urban_models_medcs_rev2.shtml
http://www.bbc.co.uk/schools/gcsebitesize/geography/urban_environments/urban_models_medcs_rev3.shtml
http://www.bbc.co.uk/schools/gcsebitesize/geography/urban_environments/urban_models_medcs_rev4.shtml
http://www.s-cool.co.uk/gcse/geography/settlements/revise-it/urban-morphology

Tuesday 27 August 2013

Greenbelts

Related to the Rural-Urban fringe (see my earlier post) are greenbelts. Greenbelts were established by the Government to avoid cities in England and Scotland sprawling out across the countryside. By creating rings of heavily protected open land around large cities and urban areas, it is hoped that the countryside will be protected from development and in some severe cases, stop two cities merging into each other. It is very unusual to get planning permission granted for sites within greenbelts, but some proposals do get through (such as the M25) due to great pressure and need for things like roads.
The Hindhead tunnel is a great example of where building in greenspace does not mean destroying the environment. In a move to reduce congestion in Surrey, where the A3 narrows to a single carriageway in Hindhead, a tunnel was built to link the two parts of the duel carriageway. This tunnel goes underneath a Site of Special Scientific Interest (SSSI). It apparently took 10 years to decide that a tunnel was the only option (a cutting would have damaged the SSSI). Engineers who worked on the project believe that there is a net benefit to the environment, especially due to the 200,000 trees which were planted. At 1.8km long, the tunnel is currently the longest road tunnel in the UK which goes under land (rather than water).
One of the only negative impacts of greenbelts, in general, is that they have led to commuters having to travel further into work. Below is a map to show the distribution of greenbelts in the UK (from the s-cool website):


References
http://www.bbc.co.uk/news/uk-england-surrey-14298318
http://www.bbc.co.uk/news/uk-england-surrey-14278289
http://www.s-cool.co.uk/gcse/geography/settlements/revise-it/the-rural-urban-fringe

Monday 26 August 2013

Shoplife

I’m not normally one for watching BBC Three documentaries, but with a sister about to embark on a year placement at one of the largest retail brands in the UK, I was intrigued to watch Shoplife. Based in the Metrocentre in Gateshead, the documentary follows a group of young people working in the shops there. It was fascinating and got me thinking about the geography of such a retail centre. During my own studies at school we learnt about the regeneration of Reading and the new (at the time!) Oracle centre.

Despite shopping being at the heart of the urban model and urban change, out of town shopping centres, such as the Metrocentre, are not covered much in the settlement section. During KS3 it is covered under “Human Processes” and at A Level, shopping centres can be studied during the “Geographical Issue Evaluation” unit.

So, here I go, off on a tangent, to satisfy my curiosity for the geography behind this shopping centre. Here is what I found…

The Metrocentre (or intu Metrocentre as it is corporately known as), is the largest shopping centre in Britain - every day 70 000 shoppers venture through the centre’s doors. Prior to the development, the area was a power station’s waterlogged ash dump. In 1981, the area became one of the first enterprise zones set up by the UK Government. Enterprise Zones are areas which support both new and expanding businesses by offering incentives. This support meant the Metrocentre could be economically viable and so the plans were made; the aim was to provide a “shopping and leisure centre that combined the best of North American innovation with all the lessons learnt from centuries of European shopping tradition”.

Despite being an abandoned field with no access, the site did have one advantage - its location! The site is situated in the heart of Tyneside and as such, has a potential catchment of 1.5 million people within a 30 minute drive and 3 million people within one hour.

The centre itself comprises of 4 malls (red, green, blue and yellow), which together host over 340 stores and have over 50 places to eat. In 2007, the centre acquired the Metro Retail Park, which added 220,000 square foot of retail space just a short walk away from the main centre. During September 2012, the MetrOasis external catering development opened, which includes: Harvester, Toby Carvery, Starbucks and Krispy Kreme.

Regardless of being a massive development, the centre was built with people in mind. This can clearly be seen in the architecture, design and selection of materials, all of which work together to create a relaxing, safe and comfortable environment. The Metrocentre goes one leap further than just allowing natural light to flow through the building though - there are plenty of security and customer service staff on hand and even baby changing stations in the male as well as female toilets. On top of this, during school holidays the centre’s very own characters the ‘Metrognomes’ entertain children (and parents!) with free shows. They are on to a winner - after all, people are more likely to spend longer in the centre and as such, spend more money in their shops, if they feel safe, comfortable and happy in the environment.

This topic in teaching…

The large amount of information available on the Metrocentre’s website, which includes a ‘Student Information Pack’, provides an ideal opportunity for group or individual research project. Students could produce a fact file of information including things such as its history, Enterprise Zones, why it is economically viable and what the success the Metrocentre has provided to the local economy.

References
http://www.bbc.co.uk/programmes/b037wkw3
http://enterprisezones.communities.gov.uk/about-enterprise-zones/
http://www.intumetrocentre.co.uk/About-Us/General-Info
http://www.intumetrocentre.co.uk/Customer-Information#a578
http://www.intumetrocentre.co.uk/Upload/PageAttachments/page1981/files/MetroCentre%20Student%20Information%20Pack%20%20-%20February%202013.pdf           

Sunday 25 August 2013

The Rural-Urban Fringe

The Rural-Urban fringe is the land at the edge of an urban area, where the urban environment meets the country.  Within this area there is often a mixture of land uses - industry, motorways, by-passes, recreational land uses and farming all occur in the Rural-Urban fringe.
The land on the Rural-Urban fringe is often cheaper and as such, science parks, business parks and industrial estates locate there to utilise the space for expansion and good transport links. These necessary transport links (motorways and by-passes), have caused upset to environmental groups who feel that the area should be kept as green as possible (for example, the M25 which cuts through London’s greenbelt).
It’s not just motorways in the Rural-Urban fringes that cause upset. Before Heathrow’s Terminal 5 was built it was a great source of controversy. Supporters of the development hailed it as an essential for the modernisation of Heathrow, but environmental groups argued that it would increase the number of flights, noise and pollution. In March 2008, Terminal 5 opened. Heathrow does continue to have controversy surrounding its use of the Rural-Urban fringe of London though. In 2006, when the plans were unveiled for Terminal 5, there were also plans unveiled for a third runway at Heathrow. In 2009, the third runway was given the go ahead by the then Labour government, despite objections from environmental campaigners and the Conservatives. When the new coalition government came into force in May 2010, they scrapped the plans for the new runway. However, this July (2013), new plans have been submitted by Heathrow - three options (North, North-west and South-west of current site) each meant to be quicker and cheaper than previous plans. Only time will tell if Heathrow’s opposition will be able to hold off this development on this Rural-Urban fringe.
Other developments which cause controversy on Rural-Urban fringes are out-of-town shopping centres. They, like many of the other developments, take advantage of the available space, good transport links and cheap land. Many objections to out-of-town shopping centres are because people start shopping at the out-of-town centres, rather than in town, which causes the town centres to decline.
Housing may also encroach into the Rural-Urban fringe. With more and more people commuting to work, small villages expand to handle the rising numbers of people living in the Rural-Urban fringes. As a result, recreational uses of the Rural-Urban fringes, such as golf courses and leisure parks, are also built to cope with demand and to utilise the space.

As well as all the above mentioned uses, farming also occurs within the Rural-Urban fringe. However, with developers wanting more and more land to build on and agriculture being a tough way to earn a living now, farmers often come under pressure to sell their land.

References
http://www.bbc.co.uk/schools/gcsebitesize/geography/urban_environments/urban_models_medcs_rev5.shtml
http://news.bbc.co.uk/1/hi/uk/7296022.stm
http://news.bbc.co.uk/1/hi/uk_politics/7829676.stm
http://news.bbc.co.uk/1/hi/england/london/8678282.stm
http://www.bbc.co.uk/news/uk-23337754
http://www.s-cool.co.uk/gcse/geography/settlements/revise-it/the-rural-urban-fringe

Wednesday 21 August 2013

Farming in Rural Areas

In many areas of the world, farming is a large part of rural life. Farming can be categorized in terms of what is grown or reared, the size of the farm and the agricultural techniques use. The first thing to determine about farms is whether they are sedentary or nomadic. A sedentary farm is situated in the same location all the time, whereas a nomadic farmer will move from one place to another. The second thing to determine is whether the farm is arable, pastoral or mixed. Arable farming is the cultivating of crops, pastoral is the rearing of animals, and mixed is a combination of both. The third thing to look at is whether the farming is intensive or extensive. Intensive farming is high input or yields for the given land area, whereas extensive is low inputs of yields for the area of land. The last couple of definitions are commercial and subsistence. This has been covered previously, but to recap: commercial farms have crops which are cultivated and animals which are reared to be sold; while subsistence farms grow crops or rear animals for consumption by the farmer and his (or her) family.

Factors affecting farm type:

  • Capital - money is needed to set up and run a farm. There are government subsidies which farms can get, but there is still a shortage. As such, farms must be efficient and use money wisely to survive. As prices fall for farm produce, the profit margin for the farmers becomes smaller, meaning they can employ less people and buy less seeds and animals for the following year - this is a harsh downward spiral. 
  • Choice - clearly the ultimate decision of what the farmer farms is up to them. However, in the past this decision has been determined by the climate, soil and relief, farmers are increasingly choosing the crops or animals which will bring them the most money, rather than the best suited to the land.
  • Climate - this is one of the most important physical factors affecting farm type. Farmers must consider the number of hours of sunshine the crops will get, the average temperature and the amount, type frequency and intensity of rainfall. Altitude and wind also play a large part.
  • Aspect - linked with the climate and the amount of sunshine the crops will get is the aspect. Farmers need to take into account whether the plot of land is Ubac (shady) or adret (sunny).
  • Labour - centuries ago farms would have to be located close to where there were plenty of men to complete the labour intensive jobs around the farm. Now, however, with farming becoming more mechanised there is less need for large numbers of workers, so just a few people are needed to manage the farm.
  • Market - like any business, market is very important. There must be the demand for the product and the farmer must be able to make a profit. Subsidies as mentioned in the capital section have helped farmers enormously over the last 20 years.
  • Politics - this covers the land tenure / ownership (rent, share-cropping and state control); organisation (collective, cooperative, agribusiness and family farms); government policies (subsidies, guaranteed prices, ESAs, quotas and set aside); as well as war which encompasses disease and famine.
  • Relief and slope - the two come hand in hand, slope is the gradient and relief is the altitude. Altitude affects farming types. Flat, low altitude, sheltered areas are best to grow crops and they also allow for easy access with large machinery. Steep slopes, high up in the mountains, are best for sheep, cattle and goats as the animals are hardy and can cope with the harsher environments. There are exceptions, such as the rice terraces on the steep slopes in Indonesia.
  • Soils - the soil fertility is important when choosing crops to grow, the pH, cation exchange capacity and nutrient status can all affect the farm type. The structure, texture and depth also have a great impact. Thick, well-irrigated, often alluvial soil is usually the best for crop farming. In hilly areas the soil is thinner and less fertile, which is why this is better for grazing sheep and cattle.
  • Pests - farmers must be aware of what the risks are of vermin, locusts and diseases within the area and plan accordingly.

Organic farming:

This type of farming has become increasingly popular in recent decades - its produce is commonly seen on our supermarket shelves. Organic farming does not use chemical fertilisers or feed additives in animal food. Farmers must rely on natural types of farming, such as introducing ladybirds to eat the aphid pests and other natural farming ways such as crop rotation.

The organic farming industry is worth over £1million a year, which is big attraction to many farmers. There are plenty of other positives too, such as: an increase in soil condition due to the manure used; the local environment benefits because natural habitats are not destroyed; the land’s biodiversity increases as there are no chemicals harming the insects and also the food is healthier for people.

There are however some negatives: firstly the crop yield is lower on organic farms (by about 20%); secondly (which is crucial to British organic farmers), most of the organic food sold in UK shops is imported; also, more produce is damaged by pests in organic farming than regular farming and weed control has to be done mechanically which is time consuming; as well as these issues, some organic pesticides such as copper can remain in the soil and be harmful. The final negative point is that because of the diet of cattle, organic dairy farms produce more methane per animal than non-organic farming. Another point to consider is that with the tough economic times, buying organic produce is a luxury many people will choose to cut out of their lives when money is tight.


The topic in teaching…

Farming lends itself to a comparison activity. The factors affecting farm type have been given above. These can be analysed and by applying the knowledge they have gained, the students can look at the distribution of farming in different parts of the UK. This could be done as a matching pairs activity with descriptions of different climates, reliefs and locations compared to markets etc., to be matched with the different types of farming (arable, market gardening, hill sheep farming, dairy farming and mixed farming).

Agriculture is a complex topic which has many different aspects which one could explore. There is the whole world of agricultural ecosystems, the ‘Common Agricultural Policy’, the green revolution, agricultural models (such as Von Thunen’s model, Sinclair’s model and Hagerstrand’s model), as well as the environmental issues and impacts agriculture is creating in the UK. However, for now, as I’m just exploring agriculture as part of rural life, I’m going to stop here before I get carried away.

References
Nagle and Spencer, 1997. Advanced Geography Revision Handbook. Oxford University Press.
http://www.bbc.co.uk/schools/gcsebitesize/geography/rural_environments/farming_rural_areas_rev1.shtml
http://www.s-cool.co.uk/a-level/geography/agriculture
http://www.s-cool.co.uk/gcse/geography/agriculture

Friday 9 August 2013

Sustainable Rural Changes

During the changes in rural areas I mentioned I would talk about ‘sustainable rural changes’ in a later post… and here is that post!!! To make changes sustainable means to protect the resources, maintain the economy and not let the standard of life suffer for the present residents or any future residents. As mentioned in the blog post about second homes, it is very difficult to make sure every aspect of rural change is sustainable.


Below are some approaches which help towards achieving more sustainability in MEDCs:
  •  Local people can form co-operatives to provide services. A co-operative is a business owned and run by its members; everyone has a say in how the business is run and all share equally in the profits. There are currently over 5400 independent co-operatives within the UK. These aren’t necessarily just the local post office or shop either - Sheffield Renewables, for example, were set up to generate green power and profit from the river running through the city. Another example is Dulas, a fast growing worker owned green technology business in Wales. However, if you want a classic example of a local shop becoming a co-operative, the BBC Bitesize points to Berrynarbor, Ilfracombe. The village has a local community shop almost half the villagers invested in, which even includes the use of a computer and space to stop for a coffee.
  • The second approach to achieve sustainability in MEDCs is to get help from the government. The Environmental Stewardship Scheme, run by DEFRA is one example. This provides funding to farmers (and other land managers) to improve the landscape, promote public access and conserve wildlife. There are four stages to this scheme: Entry Level Stewardship, Organic Entry Level Stewardship, Uplands Entry Level Stewardship and Higher Level Stewardship.
  • For really deprived areas of the UK, the EU can fund regions through funds such as the European Regional Development Fund. However much money the EU puts in, the British government has to match the amount. In the blog post on second homes I mentioned Cornwall and how it is one of the poorest places in Britain with incomes 25% below average. According to the Guardian, Cornwall is the only corner of the UK to receive this aid from the EU.
  •  National Parks in the UK are one of the best places to see sustainability approaches in action. They are also great places to aid students understanding the conflicts between recreation and conservation.  Conflicts can be managed by clear signage for tourists, restrictions on developing land and restrictions on traffic and park and ride schemes in some areas. The Sustainable Development Fund from DEFRA and the Welsh government have encouraged individuals and communities to find sustainable ways of living and working, while also enhancing the natural environment around them. Since the programme began Exmoor Sustainable Development Fund has awarded nearly £1.9million to more than 100 projects, while the Snowdonia National Park Authority gives out £200 000 per annum. 


Sustainable development in LEDCs:
There are four key ways of helping rural areas in LEDCs become more sustainable:
  • By improving the rural economy (including generating income within the area). The aim is that this will result in less rural-urban migration and the downward spiral associated with that.
  • By increasing rural food production. This needs to be done in a way to protect the environment and land for future generations to continue using, but should improve the standard of life for current residents by providing more food to eat and to sell to the towns.
  • By improving the rural standards of living. The beginning point for this is to ensure there is clean drinking water and safe sewerage disposal for everyone and to give the local population access to education and health care. These are basic things which would improve the standard of life for current residents as well as generations to come. Education will also help develop other parts of sustainability in rural areas as the locals learn more about their environments.
  • By improving standards of communication to help rural people keep in touch with developments. Better access and links to towns allows exchange of information, goods and products, such as the food mentioned above.

Many charities work within LEDCs to help rural communities become more sustainable. Some work alongside communities, teaching organic farming methods to boost crops and increase yields. Others such as ‘The Water Project’ provide access to safe water via pumps, which in turn improves health, education, hunger and can also break the cycle of poverty. Other charities help to develop self-sufficiency within the community, so that when the organisation goes, the community can continue to thrive. Some charities boost confidence and community spirit, so that communities help themselves to prosper.


References
http://www.bbc.co.uk/schools/gcsebitesize/geography/rural_environments/changes_rural_areas_ledcs_rev2.shtml
http://www.bbc.co.uk/schools/gcsebitesize/geography/rural_environments/changes_rural_areas_medcs_rev2.shtml
http://www.theecologist.org/campaigning/culture_change/1328920/how_to_start_a_cooperative_in_five_steps.html
http://www.eryri-npa.gov.uk/park-authority/cae-introduction
http://www.exmoor-nationalpark.gov.uk/communities/sustainable-exmoor
http://www.theguardian.com/uk/2007/nov/18/ruralaffairs.immigrationpolicy
http://www.nationalparks.gov.uk/lookingafter/sustainable-development.htm
http://thewaterproject.org/why-water.php